柔性滑动窗分析
weighslide的Python项目详细描述
称重滑块
weighslide是一个python程序,用于计算数值列表上的滑动窗口。
用户设置窗口大小,以及窗口中每个值的确切权重。
它是用来干什么的?
weighslide是为生物信息学而开发的。α螺旋是常见的蛋白质二级结构,具有 每转3.6个残基的周期性。weighslide允许根据α螺旋周长对数值进行加权。
请注意,weighslide目前没有针对大型数据集进行优化。
引文:
稍后将添加出版物。目前,请引用以下内容:
“使用python中的weighslide包执行滑动窗口分析(mark teese,慕尼黑技术大学)。”
关键词:
滑动窗口、滚动窗口、加权窗口、数据规范化、数据规范化、一维数组、数字列表
工作原理
weighslide将数字数据的一维数组(列表)作为输入,并以滑动窗口的方式在数据上应用用户定义的权重和算法。
For example:
window = [ 2  5  2 ]
statistic = "mean"
dataset = [ 0  0  0  1  1  2  3  5  8  13  21]
The window length is 3. The array will therefore be sliced as follows:
........[ NaN  0  0 ]
.............[ 0  0  1 ]
................[ 0  1  1 ]
...................[ 1  1  2 ] and so on until the final slice [ 13  21  NaN ]
Each array slice will be "weighted" by multiplication with the window, array-style, resulting in:
........[ NaN  0  0 ]
.............[ 0  0  2 ]
................[ 0  5  2 ]
...................[ 2  5  4 ] and so on.
If the "statistic" variable is given as "mean", a mean will be calculated for each array slice.
..........[    0    ]
.............[   0.66  ]
................[   2.33  ]
...................[  3.66  ] and so on.
The "statistic" can be mean, std, or sum.
The value (in this case the mean) will replace the central position in the output 1D array.
output = [ 0.00  0.00  0.66  2.33  3.66  6.00  9.66  15.6  25.3  41.0  65.5  ]
第一个和最后一个数组切片始终包含侧翼“not a number”(nan)值,在所有计算中都会忽略这些值。
因此,第一个和最后一个输出值并不表示来自真正的、全长窗口的结果。
安装
pip install weighslide
称重滑块取决于以下各项:
- python(测试版本3.5)
- 努比
- 熊猫
- matplotlib
对于windows用户,我们建议使用anaconda python 3.x。anaconda包应包含所有必需的python包。
要从github安装为python包,请下载并解压缩最新版本,并在相关的包文件夹中运行python setup.py install。
测试
要测试包,请打开命令控制台并导航到文件夹
包含weighslide.py。运行以下命令:
python weighslide.py [1,1,"x",1,1] mean -r [1,1,2,3,5,8,13,21,34]
如果成功,输出列表将打印在屏幕上。
用法
下面是一个如何在python中使用excel输入文件运行weighslide的示例。
import weighslide
infile = r"D:\Path\To\Your\File\infile_name.xlsx"
# for excel files, you will need to input the sheet name containing the data
excel_kwargs = {"sheet_name":"Sheet1"}
# if it's an excel file with multiple columns, define which column contains the data
column = "your data column header"
# define the window and statistic. The following parameters are used
# if you want to calculate mean of the four surrounding values in the sequence
window = [1,1,"x",1,1]
statistic = "mean"
name = "your short sample name"
weighslide.run_weighslide(infile, window, statistic, name=name, column=column, excel_kwargs=excel_kwargs)
下面是一个如何使用csv输入文件从命令行运行weighslide的示例。
python weighslide.py [1,1,'x',1,1] mean -i "D:\Path\To\Your\File\infile_name.xlsx" -c "your data column header"
在这两种情况下,输出文件都将在与输入文件位于同一位置的子文件夹中创建。
有关命令行选项的更多帮助:python weighslide.py -h
下面是为Jupyter笔记本设计的一个例子,展示了Weighslide的强大功能
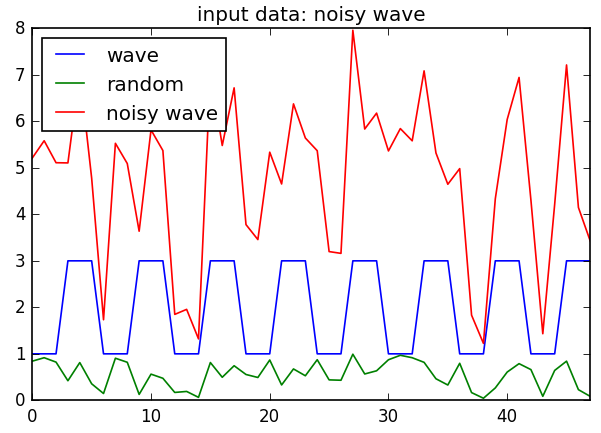
平滑噪声数据集中的重复元素。
# create a noisy wave that repeats every 6th position. Save to csv.
import weighslide
import numpy as np
import pandas as pd
import matplotlib.pyplot as plt
% matplotlib inline
plt.rcParams["savefig.dpi"] = 120
df = pd.DataFrame()
df['wave'] = [1,1,1,3,3,3]*8
df["random"] = np.random.random_sample(df.shape[0])
df["noisy wave"] = df.wave + df.random*5
df.plot(title="input data: noisy wave")
df.to_csv("wave.csv")
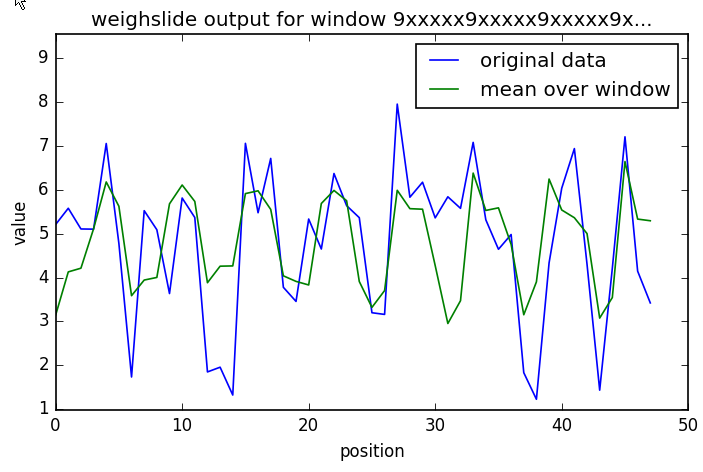
# run weighslide with a window that averages every 6th position
window = "9xxxxx9xxxxx9xxxxx9xxxxx9xxxxx9xxxxx9"
weighslide.run_weighslide("wave.csv", window, "mean", name="wavetest", column="noisy wave", overwrite=True)
窗口示例:
[1,1,1]
- 如果“statistic”设置为“mean”,则此窗口返回中心位置和两个相邻位置的平均值
- 窗口大小为3
[1,1,“x”,1,1]
- 中心位置“x”完全没有权重
- 窗口大小为5,由中心位置、两个上游位置和两个下游位置组成
- 中心位置的上游位置(-1,-2)和下游位置(1,2)的权重均相等
- 如果统计设置为“平均”,则每个位置的结果仅为周围4个位置的平均值
[0.5、1、0.5、2、0.5、1、0.5]
- 中心位置“2”高度加权(2*原始值)
- 窗口大小为7,由中心位置、三个上游位置和三个下游位置组成
- 中心位置的上游位置(-1,-2,-3)和下游位置(1,2,3)的权重不相等
- 如果统计设置为“平均”,则每个位置的结果仅为周围4个位置的平均值
贡献
如果您遇到一个bug或weighslide由于任何原因不起作用,请给我发送一封电子邮件(在下面的图片中或在我的tum网站上提供)或在github中发起一个问题。
欢迎请求。
许可证
weighslide是在gnu通用公共许可版本3下发布的免费软件。
联系人
欢迎加入QQ群-->: 979659372
