traja是一个轨迹分析和可视化工具
traja的Python项目详细描述
traja python ver travis pypi rtd gitter black license binder codecov doi
。| python版本图像:https://img.shields.io/badge/python-3.6+-blue.svg :目标:https://www.python.org/downloads/release/python-360/ :alt:python 3.6+
。|特拉维斯图片:https://travis-ci.org/justinshenk/traja.svg?branch=master :目标:https://travis-ci.org/justinshenk/traja
。| pypi图像:https://badge.fury.io/py/traja.svg :目标:https://badge.fury.io/py/traja
。|吉特图片:https://badges.gitter.im/traja-chat/community.svg :目标:https://gitter.im/traja-chat/community
。| RTD图像:https://readthedocs.org/projects/traja/badge/?version=latest :目标:https://traja.readthedocs.io/en/latest/?badge=latest :alt:文档状态
。|黑色图像:https://img.shields.io/badge/code%20style-black-000000.svg :目标:https://github.com/ambv/black
。|许可证图像:https://img.shields.io/badge/License-MIT-blue.svg :目标:https://opensource.org/licenses/MIT :alt:license:mit
。|活页夹图片:https://mybinder.org/badge_logo.svg :目标:https://mybinder.org/v2/gh/justinshenk/traja/master?filepath=demo.ipynb
。| codecov图像:https://codecov.io/gh/justinshenk/traja/branch/master/graph/badge.svg :目标:https://codecov.io/gh/justinshenk/traja
。| doi图像:https://zenodo.org/badge/166056696.svg :目标:https://zenodo.org/badge/latestdoi/166056696
traja是一个用于轨迹分析的python库。它扩展了 专门用于动物轨迹分析的熊猫数据帧,并提供 与其他几何分析包(如R和Shapely)的便捷接口。
简介
traja python包是一个用于数字特性描述的工具包。 分析动物的运动轨迹。轨迹分析 适用于各种领域,如最佳觅食理论, 迁移和行为模拟(例如,用于验证 移动)。轨迹只是路径的记录,然后是 移动的动物。traja以一系列 位置(x,y坐标)随时间变化。可获得轨迹 通过提供此信息的任何方法,包括手动 跟踪、无线电遥测、GPS跟踪和运动跟踪 视频。
这个包(和这个文档)的目标是帮助生物 研究人员可能对python没有丰富的经验, 在不受有限知识限制的情况下分析轨迹 python或编程。然而,对python的基本理解是 有用。
如果您在出版物中使用traja,请引用[添加引文]。
安装和设置
要使用conda安装traja,请运行
conda install -c conda-forge traja
或使用pip
pip install traja。
使用python traja-gui.py运行图形用户界面。
将traja导入到python脚本中,或通过python命令行
import traja。
带有traja的轨迹
traja在pandas数据框中存储轨迹,允许任何pandas 要使用的函数。
使用x、y和时间坐标加载轨迹:
。代码块::python
import traja

df = traja.read_file('coords.csv')
加载数据帧后,使用.traja访问器访问
可视化和分析方法:
。代码块::python
df.traja.plot(title='Cage trajectory')
分析轨迹
通过traja.trajectory.[method]可以使用以下功能:
| Function | Description |
|---|---|
| ^{ | Calculate derivatives of x, y values |
| - | - |
| ^{ | Calculate turn angles w.r.t. x-axis |
| - | - |
| ^{ | Calculate first-order Markov model for transitions between grid bins |
| - | - |
| ^{ | Generate random walk |
| - | - |
| ^{ | Resample to consistent ^{ |
| - | - |
| ^{ | Rediscretize points to given step length |
随机游走
使用
。代码块::python
df = traja.generate(n=1000, step_length=2)
df.traja.plot()
。图片:https://traja.readthedocs.io/en/latest/_images/sphx_glr_plot_with_traja_003.png :alt:walk_screenshot.png
再结晶
使用traja.trajectory.rediscretize重新将轨迹确定为一致的步长,其中R参数为
新的步长。
。代码块::python
rt = df.traja.rediscretize(R=5000)
rt.traja.plot()
。图片:https://traja.readthedocs.io/en/latest/_images/sphx_glr_plot_with_traja_004.png :alt:重新加密
重新采样时间
traja.trajectory.resample_time允许通过step_time重新采样轨迹。
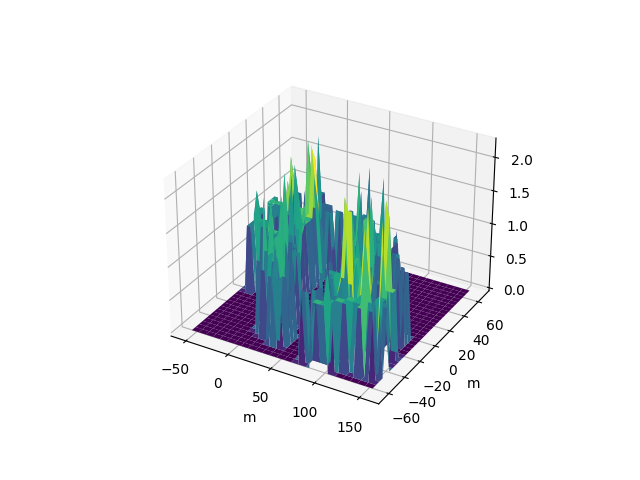
流程图
。代码块::python
df = traja.generate()
traja.plot_surface(df)
。图片:https://traja.readthedocs.io/en/latest/_images/sphx_glr_plot_average_direction_001.png :alt:3d绘图
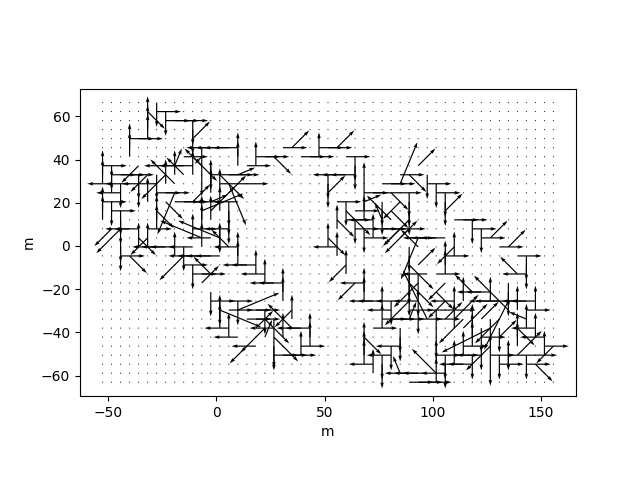
。代码块::python
traja.plot_quiver(df, bins=32)
。图片:https://traja.readthedocs.io/en/latest/_images/sphx_glr_plot_average_direction_002.png :alt:quivel绘图
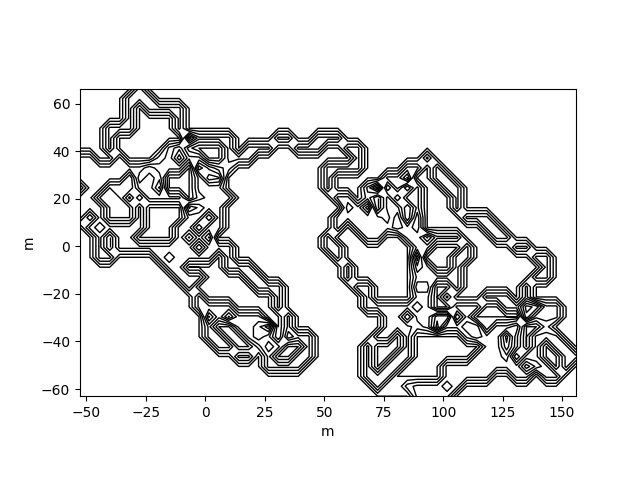
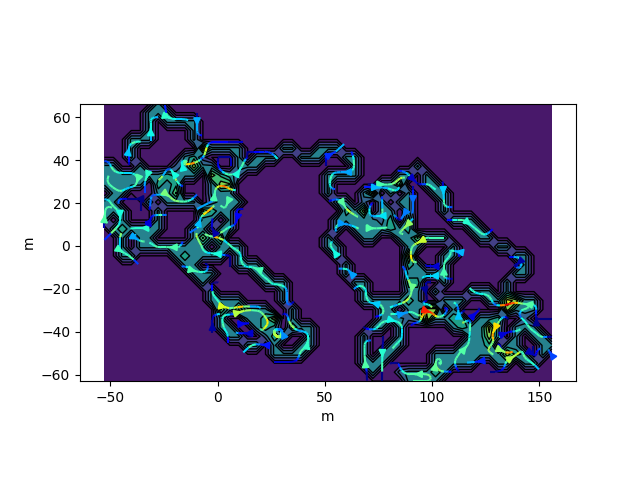
。代码块::python
traja.plot_contour(df, filled=False, quiver=False, bins=32)
。图片:https://traja.readthedocs.io/en/latest/_images/sphx_glr_plot_average_direction_003.png :alt:等高线图
。代码块::python
traja.plot_contour(df, filled=False, quiver=False, bins=32)
。图片:https://traja.readthedocs.io/en/latest/_images/sphx_glr_plot_average_direction_004.png :alt:填充等高线图
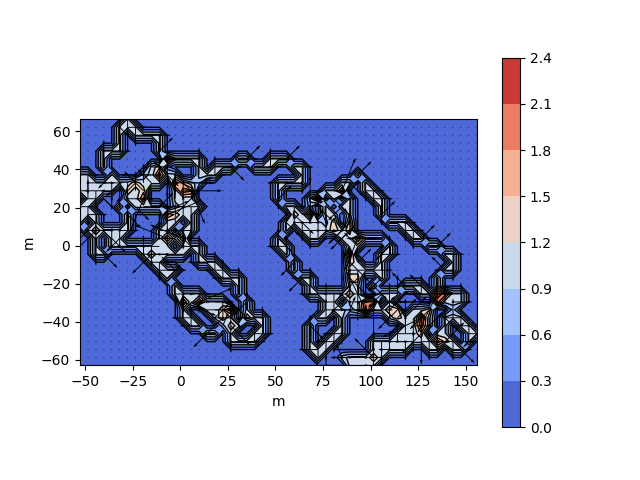
。代码块::python
traja.plot_contour(df, bins=32, contourfplot_kws={'cmap':'coolwarm'})
。图片:https://traja.readthedocs.io/en/latest/_images/sphx_glr_plot_average_direction_005.png :alt:streamplot
致谢
traja代码实现和分析方法(特别是
rediscretize_points)很大程度上受到了Jim McLean的R包的启发
trajr <https://github.com/JimMcL/trajr>。非常感谢吉姆
反馈。
欢迎加入QQ群-->: 979659372

